Monday, March 2, 2026
The Slender Thread refers to the sources of financial resources needed by private colleges and universities to survive the upcoming demographic cliff. There will be five Slender Threads in this series. The order is: 1 – Enrollment Trends, 2 – Relationship of Tuition Discounts to Enrollment, 3 – Effect of Changes in Enrollment on Unrestricted Funds, 4 – Change in Total Net Assets, and 5 – Basic Survival Rules for Slender Threads.
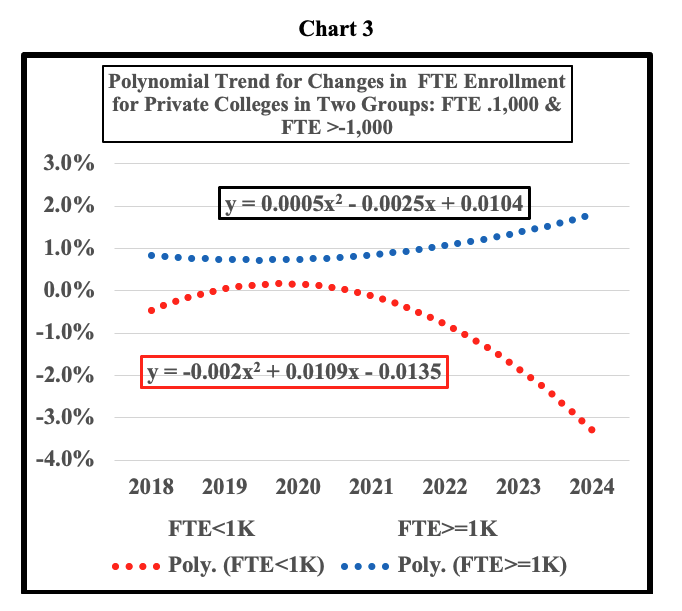
This study used IPEDs data from 2017 to 2024 to compute the enrollment to unrestricted net asset ratio for 944 private colleges.[1] This set of colleges was split into two enrollment groups: FTE < 1,000 students and FTE >= 1,0000 students. The data was then averaged for the two groups for each variable by year. The first chart has the basic data trend for both sets of private colleges, and the next two charts show the linear and a second-degree polynomial trend, i.e., a quadratic equation.
Slender – 1 covers the change in FTE enrollment for a set of 944 private colleges that are split into two FTE enrollment groups: FTE < 1000 and FTE >= 1,000. Changes in FTE enrollment is a critical factor for most private institutions because most of their revenue is generated from enrollment.
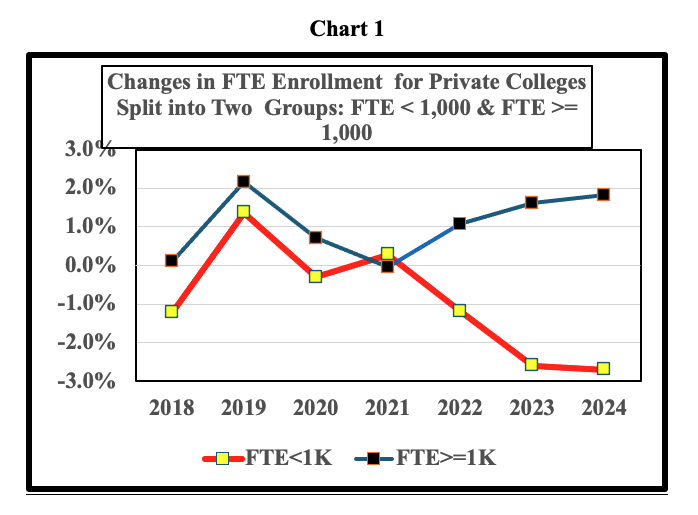
Chart 1 clearly shows that FTE enrollment in the small college group (FTE< 1,000) started to fall in 2016, then took a small jump in the latter stages of the COVID pandemic. After 2021, changes in FTE enrollment for small colleges resumed their steady decline through 2024 with a slight moderation of the rate between 2023 and 2024.
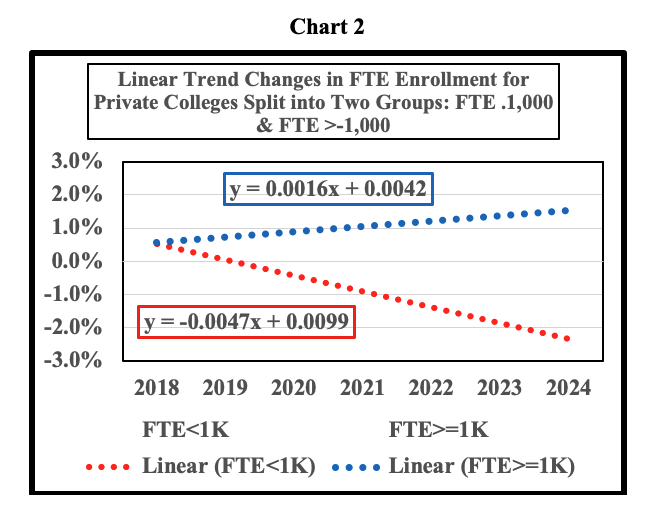
Charts 2 and 3 provide added support that small colleges have had a trying time stemming enrollment decline since 2018 except for the anomaly of 2021. It does not require a complicated analysis to suggest that small colleges will face tremendous pressure to keep their head above water during the impending demographic cliff after 2026. These three enrollment charts clearly show that delaying strategic change could doom the college given that most small colleges are heavily dependent on tuition revenue to survive.
Editorial Assistance by Jack Corby, Vice President of Stevens Strategy.
[1] The data set includes 44 private colleges from IPEDS for the period 2017 to 2024 that offered a four-year degree subject to these exclusions because they have different business models: seminaries, yeshivas, art and music schools, research colleges, and colleges with missing data. The last year for the data is 2024; This set of colleges was split into two enrollment groups: FTE < 1,000 students and FTE >= 1,000 students. The data was then averaged for the two groups for each variable by year. The first chart has the basic data trend for both sets of private colleges, and the next two charts show the linear and a second-degree polynomial trend, i.e., a quadratic equation.