Several years ago, higher education leaders predicted a nice bump in the size of the prospective student pool between 2021 and 2024. However, recent enrollment data indicates that enrollments are continuing to decline following the surge in the COVID pandemic in 2020. Nathan Grawe in 2019, wrote that the financial crisis of 2008 led to fewer births that year, which would impact the student market beginning in 2026. (This outcome is apparent in Chart I later in the discussion.) Grawe also stated that declining enrollments in the eight years prior to 2018 were:
“… the result of a demographic plateau. Surely the current downward trend largely reflects recovery from the deepest recession in modern economic history. Even as we contemplate new demographic trends, we should not lose sight of the many ways in which economic forces drive a range of educational outcomes, including enrollment, the desire for credentialing, and trends in students’ choices of academic majors.”
It appears that as new students consider the choice between enrolling in college and other options, that fewer are choosing college, be it 2- or 4-year colleges. The reasons for a shift in the choice decision may be attributed to the cost of debt, the low-payoff for some majors, government incentives for the workforce to remain unemployed, or as yet other unplumbed reasons. While it’s most likely a bit early to understand the consequences, the impact of remote learning throughout the pandemic may also be changing prospective students’ enrollment behavior.
As confounding as dwindling student markets are toward college budget, so also is the rise in the cost of skilled and unskilled labor due to tight labor markets. As will be considered at the end of this piece, the confluence of falling enrollments and tight labor markets could have a profoundly negative effect on the financial viability of many private colleges.
Births and Tuition Net Revenue
The COVID-19 pandemic had the potential of pushing a number of private colleges to the brink of survival. However, many were saved by large cash grants from the federal government. Yet, college leaders recognized that the pandemic would soon be followed by a demographic crash in the student market resulting from a sharp decline in births starting in 2000, and followed by another, sharper decline between 2006 and 2010.
Chart 1
Change in the Number of Births between 2000 and 2020
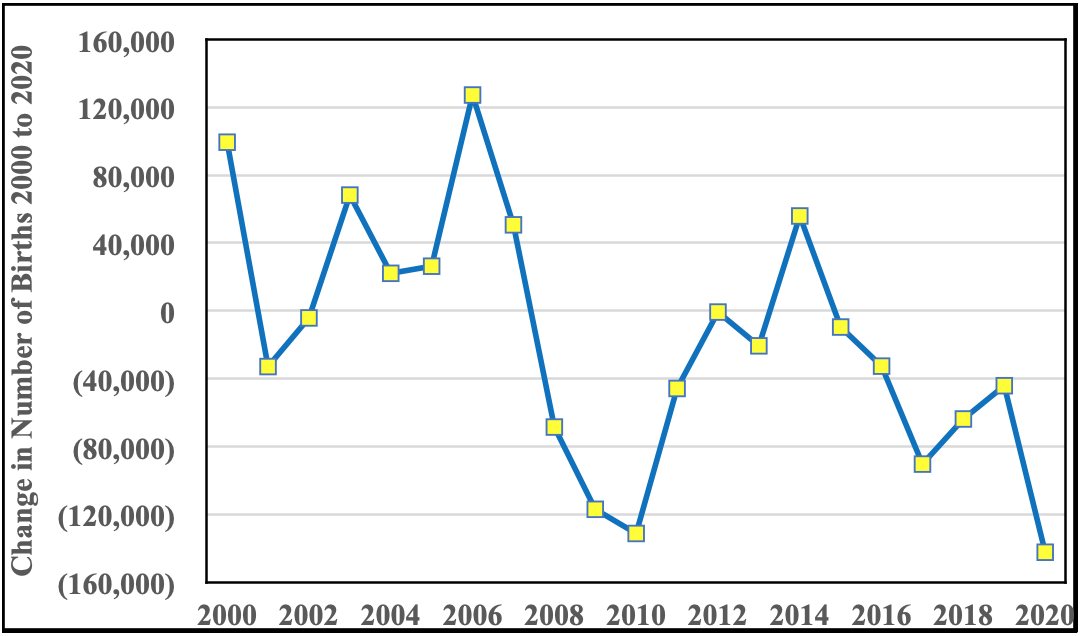
If the declining births in the early part of this century are pushed forward eighteen years to the traditional college entry age, the effect of the decline on enrollments can be more readily discerned. The first big decline in 2019 would be followed by a recovery through 2021 with a further decline from 2022 and 2023 and then a strong recovery in 2024 followed by a precipitous decline lasting until 2028.
Unfortunately for colleges, the first recovery year from trough in the 2003 births expected to occur in 2021 was quashed by the pandemic. Most colleges were able to absorb the unexpected enrollment decline and concomitant loss of student revenue through large federal grants.
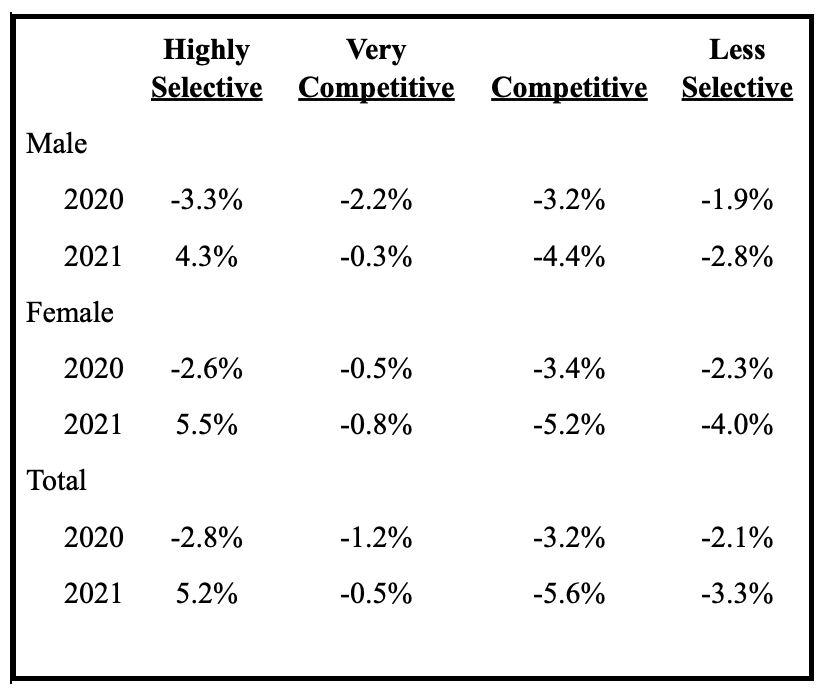
However, the exception in 2021 was enrollment of female and male students at highly selective private institutions, where enrollment increased. Table I contains some very worrisome news for less selective private colleges because they generally reported further deterioration in enrollment. Moreover, less selective institutions must also be concerned that the momentum provided by female enrollment to offset long-term waning of male enrollment is slipping away. If the growth in enrolling women is slacking off, then many less selective private colleges could be in deep financial trouble.
Table 1
Private Not-for-Profit Colleges; Changes in Enrollment by Selectivity and by Gender
In several important ways, the decision to go to college may no longer be mainly influenced by parents. In prior decades, the decision to enroll in college was mainly influenced by the income and educational level of parents. There seems to be accumulating evidence that enrolling in college and in a particular academic program is becoming more dependent on financial outcomes. In other words, uncertainty in the predictability and scale of enrollments will not diminish in time, as prospective students become more interested in whether their investment will pay off in the job market.Colleges must now hope that the big recovery in births on 2005 and 2006 will lead to a strong increase in enrollments in 2023 and 2024. If enrollments do surge in that period, colleges may be granted a brief two-year period to rebuild financial resources and implement new strategies. If enrollment does not improve during this period, then private, and in particular, resource poor private colleges, may find that their financial condition is beyond repair. Even if enrollment does expand between 2023 and 2024, the steep fall in the new student market by 2028 (see Chart I) does not bode well for resource poor, less-selective colleges. Even worse, population data indicates that higher education will be struck by another collapse in the student market between 2034 and 2038. When the next major decline occurs in ten years, no one can reliably predict the impact of new technology in substituting classrooms with virtual-reality or corporations taking over large chunks of educating prospective employees because many college graduates lack significant work-related skills, unlike in previous generations.
As a sidenote, the effect on college enrollments from the massive influx in new immigrants in the recent past is not known and may not become evident for several years as these recent immigrants and their children become more fully assimilated into society and the economy.
Labor and Cost in Higher Education
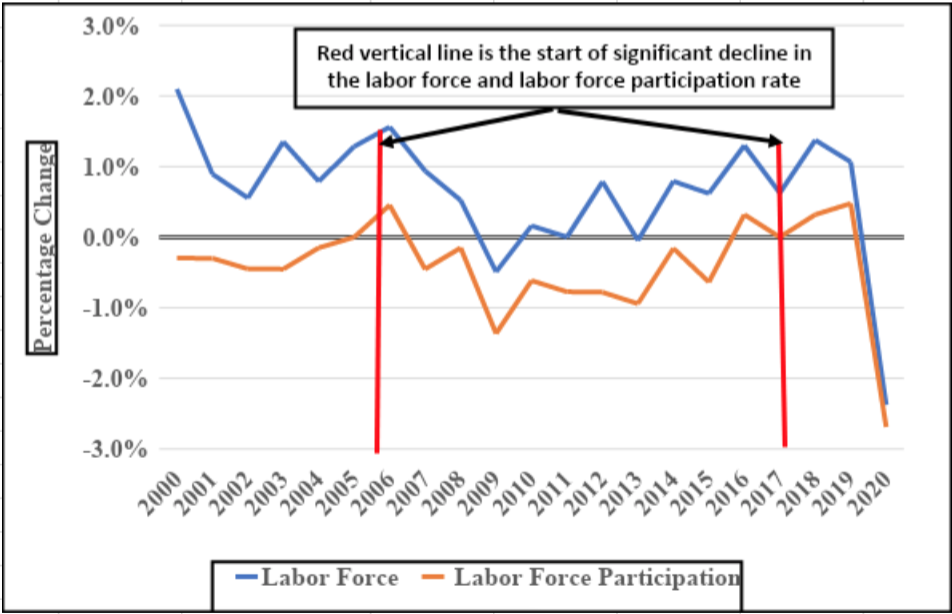
Labor and the cost of labor has always been a major issue in college operations. The problem of labor cost is not new; recall that cost-of-living adjustments (COLA) were a common aspect of salaries and payrates during the high inflationary period that ran from the early 1970s to the early 1980s. This period of inflation was called stagflation because inflation was high and economic growth was low. Chart II has two inflections in 2006 and 2020, the first inflection represents the high point in real estate construction leading to a debt crisis and economic crash. The second inflection is a small decline that preceded a massive decline in the labor force and the labor participation rate. Hiring has become problematic because the labor force and the participation rate fell dramatically and do not show clear indications of being able to support economic recovery after the worst of the COVID pandemic.
Chart II
Percentage Change in the Size of the Labor Force and the Labor Participation Rate
The New York Post included an explanation of the decline in the labor force and participation rate for the last year based on data that was available in December of 2021. The main points of this article are:
- “There are some 3.6 million fewer workers than there were in February 2020. By some measures, the number is much higher and could be 6 million, according to Moody’s Analytics chief economist Mark Zandy.”
- “The majority of the missing workforce are people 55 and older – some 2.4 million people – who either retired early by choice because they could financially or low-income retirement-age workers who were axed at the start of the outbreak. COVID-19 nearly doubled the retirement rate for 2020, fueling the largest exit of older workers from the workforce in at least 50 years.”
- “There’s also the simple, tragic fact that the pandemic has claimed 800,000 lives — and about half a million of those victims were working-age adults.”
- “The rest of the missing workforce is a combination of people in two-salary families who decided to make due with one income; those who’ve decided to start their own business or take “gig” employment; and discouraged workers with low incomes.
- “The US Census Bureau’s Household Pulse Survey also noted on Wednesday that about 4.9 million said they were not working because they were taking care of children who were not in school or day care (Some of these people show up on the unemployment numbers because they are still looking for work.)”
What Do Student and Labor Market Shortages Mean to Higher Education?
The confluence of student and labor market shortages will bring considerable pain to many private colleges and universities. First, price competition will accelerate as colleges try to attract students from a small market. Typically, price competition in higher education takes the form of tuition discounts. According to the annual tuition discount report by the National Association of College and University Business Officials, the average tuition discount for new students in 2020/21 was 53.9%. A tuition discount of 53.9% means that a college only receives about forty-six cents in cash on the dollar. There is even evidence that some private colleges are discounting tuition for middle-income students between 62% and 79%. Those colleges are only receiving from their middle-income students between thirty-eight cents and twenty-one cents on the dollar. It is hard to fathom how these colleges will be able to fund operations at those high discount rates. If more colleges move to these out-sized tuition discounts, many private colleges are going to be pressed to the wall. Speaking to this last point about ever higher tuition discounts, NACUBO in a 2020 survey of business officers found that 80% believed that COVID would have a continuing effect on tuition discounting. The combination of COVID and shrinking student markets will drive out the cash needed to support operational expenses.
In the case of labor rates, as labor markets shrink and organizations seek to hire more employees, the common economic response will be to either raise pay rates or replace employees with capital equipment. Higher education does not have the technology or the customer base to replace employees. The administrative information technology systems are expensive and are not designed to replace staff. Moreover, accreditation standards usually limit reductions-in-force in professional positions. However, data is not currently available for private colleges to determine if a shrinking labor market is leading to higher labor rates. Nonetheless, it would not be surprising to see colleges increase their payroll as they attempt to keep their employees or hire new employees.
Summary the Confluence Crunch
Chart III
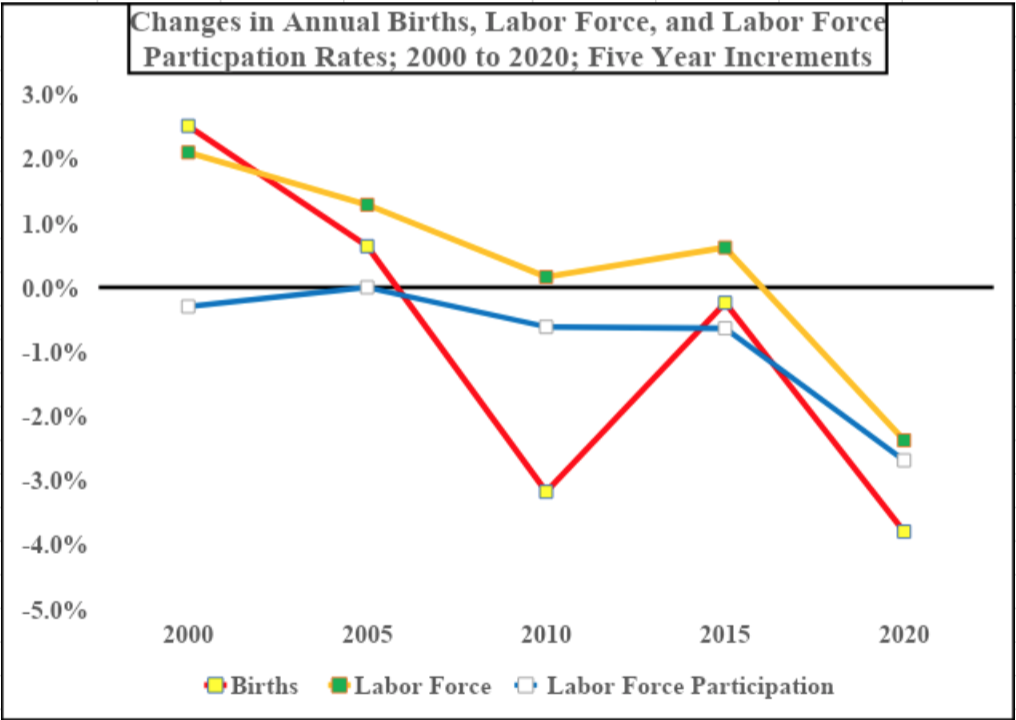
Confluence of Changes in Births, Labor Force and Labor Participation Rate from 2000 to 2020 in Five-Year Increments,
Chart III illustrates how birth rates, the labor force, and labor force participation rates have moved in lockstep between 2015 and 2020. Even though the chart does not include 2021 data, it is hard to imagine that the picture improved in the middle of the COVID pandemic.
Shrinking student and labor markets could well produce a crunch because cash lost from higher tuition discounts will produce shortages that affect the ability to meet rising labor pay rates. If private colleges cannot resolve this conundrum, many private colleges will fall by the wayside, forced to close leaving only memories to alumnae/alumni and former employees.
Our Consultants
 John Stevens, Ed.D.
 Brendan Leonard, M.B.A.
-

IMPORTANT ANNOUNCEMENT FROM STEVENS STRATEGY September 7, 2023 - 2:26 pm
-
For Whom the Bell Tolls? August 18, 2023 - 3:45 pm
-
FOR STRUGGLING TUITION-DEPENDENT PRIVATE... June 12, 2023 - 7:53 pm
-
Is Your Institution Structurally Inefficient? June 6, 2022 - 3:04 pm
-
Advertising in an Era of Fierce Price Competition February 1, 2022 - 4:13 pm
-
A Modest Proposal for An Alternative to the... November 7, 2011 - 4:15 am
-
The Trustees’ Role in Institutional Innovation | Stevens Strategy Blog on A Modest Proposal for An Alternative to the... January 17, 2012 at 2:46 pm